Author: Ryan

Single-Axis vs. Tri-Axis EMF Meters: Which One Do You Actually Need?

When you start shopping for an EMF meter, you’ll run into the terms single-axis and tri-axis fairly quickly. Most listings mention one or the other without explaining what the difference means in practice. This article clears that up so you can make a straightforward decision before you buy. If you haven’t chosen a meter yet, start with the best EMF meter options first.
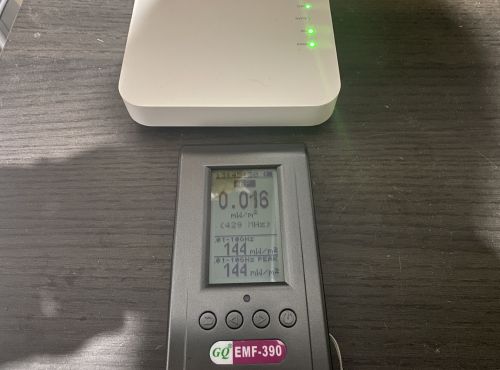
GQ EMF-390 positioned in front of WiFi router for RF measurement testing

The Core Difference

A tri-axis meter measures EMF on three planes simultaneously: left to right, front to back, and up and down. It combines those three readings internally and gives you a single number that reflects the total field strength regardless of how you’re holding the meter.

A single-axis meter measures on one plane at a time. To find the true peak reading you need to rotate the meter slowly through different orientations until the number stops climbing. The highest reading you find is your actual measurement.

It takes a little more technique but it’s not complicated once you’ve done it a few times.

What This Means When You’re Testing

For magnetic field measurements the difference matters most. Magnetic fields radiate in all directions from a source, so the angle you’re holding the meter affects what you read. A tri-axis meter handles this automatically.

With a single-axis meter you need to be deliberate about rotating to find the peak. Otherwise you can easily underread a source without realizing it.

For RF the distinction plays out differently. RF from a router or phone doesn’t radiate equally in all directions. The EPA notes that RF energy decreases as it travels and varies based on the direction and distance from the transmitter, which is exactly why a single-axis meter will give you meaningfully different readings depending on which way you’re pointing it.

I tested this directly with my router streaming video, taking readings at three feet in four orientations with both my Trifield TF2 and my GQ EMF-390. Neither meter gave its highest reading pointing directly at the router.
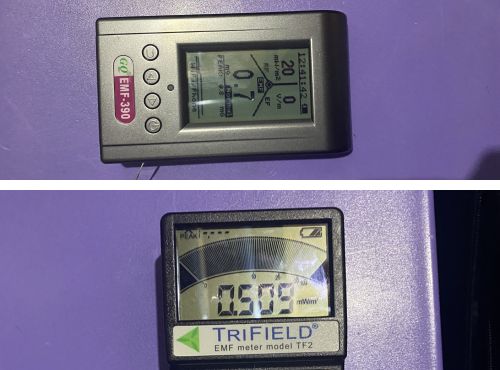
Trifield TF2 and GQ EMF-390 highest RF readings by orientation

The GQ peaked on its broadband live reading facing left at around 10 to 11 mW/m², compared to roughly 5 mW/m² pointing straight at the router. The TF2 hit its highest peak facing left as well, with readings up to 19.140 mW/m² compared to 9.388 to 9.640 mW/m² facing the router directly.

That’s not the meters being inconsistent. That’s single-axis behavior working exactly as it should, revealing that RF energy from your router isn’t coming at you equally from every direction.

An Important Clarification About the Trifield TF2

This is where a lot of people get confused. The Trifield TF2 is tri-axis for magnetic fields only. Its RF mode is single-axis, the same as the GQ EMF-390 and most other meters in this class.

If you’re testing RF with the TF2 you need to rotate it to find the peak reading just like any other single-axis meter. The tri-axis advantage disappears the moment you switch to RF mode.
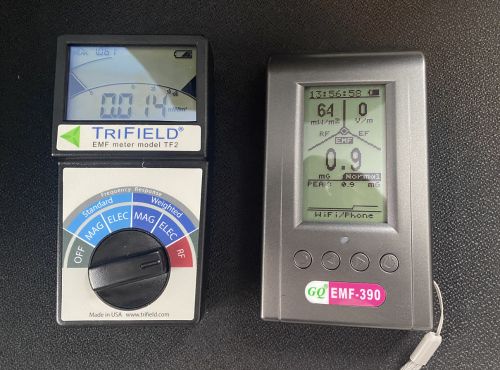
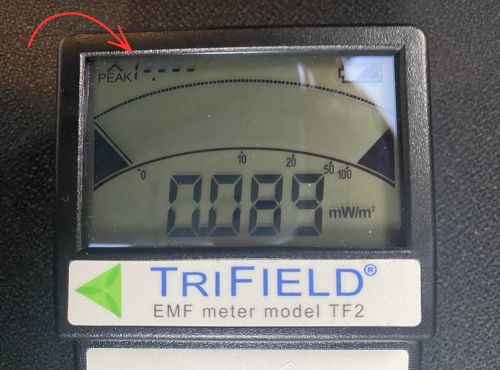
Trifield TF2 RF display showing peaked out reading above 19.999 mW/m² ceiling

The TF2’s RF mode also has a maximum ceiling of 19.999 mW/m². During my directional testing the TF2 peaked out entirely on the facing-left orientation, meaning the signal exceeded what the meter can display. For a fuller picture of how the two meters compare on RF, my hands-on testing of the GQ EMF-390 goes into detail on where each meter’s RF capability begins and ends.

For magnetic and electric field work at power-line frequencies the TF2 is excellent. For RF from modern wireless devices at close range, a meter with a higher RF ceiling gives you more complete data.

When Two Meters Show Very Different Numbers

Here’s something worth understanding if you’ve ever held two meters side by side and gotten very different RF readings at the same spot. Part of the explanation is sensitivity and RF ceiling as described above. But part of it is simply orientation.

Both meters are single-axis for RF. If they’re positioned differently relative to the source, even by a few inches or a slight angle, they can give meaningfully different readings at the same moment.
Trifield TF2 RF display showing peaked out reading above 19.999 mW/m² ceiling

This is also why a controlled test with one meter at a time, at a fixed measured distance, with a consistent orientation, gives you more reliable comparison data than holding both meters up simultaneously and reading whatever appears on screen.

What the Numbers Actually Look Like

Here’s what I measured at three feet from my router across four orientations while streaming video. The TF2 displays two numbers: the highest reading captured since the last reset (peak) and what it’s detecting right now (live). The GQ RF screen shows a broadband live reading across its full frequency range.
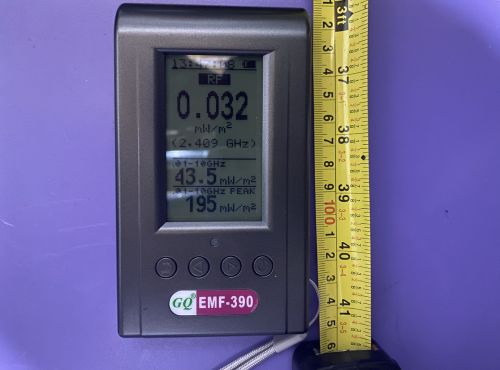
GQ EMF-390 RF screen showing broadband live reading three feet from WiFi router

Trifield TF2 — Peak Reading by Orientation (mW/m²)

OrientationPeak
Facing router9.4 to 9.6
Facing left16.6 to 19.1*
Facing right9.9 to 10.5
Facing backward11.6 to 12.2

*One reading exceeded the TF2’s 19.999 mW/m² ceiling and peaked out.
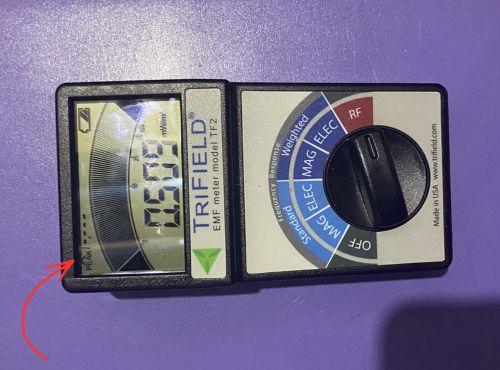
Trifield TF2 display peaked out during facing left orientation test at three feet from router

GQ EMF-390 — Broadband Live Reading by Orientation (mW/m²)

OrientationBroadband Live
Facing router4.96 to 5.59
Facing left9.69 to 11.4
Facing right13 to 20
Facing backward3.84 to 9.18
GQ EMF-390 showing 20 mW/m² broadband live reading facing right during directional router test

Both meters were positioned three feet from the router while streaming video. Each orientation was tested three times five seconds apart. Neither meter gave its highest reading pointing directly at the source.

Both meters show the same pattern: the highest readings don’t come from pointing directly at the source. If you had taken one reading pointing straight at the router and stopped there, you would have missed the true peak on both meters. That’s the single-axis lesson in real numbers.

Does Tri-Axis Always Win

Not necessarily. Tri-axis is more convenient for magnetic field testing and removes the technique requirement entirely, which matters if you’re new to testing.

But single-axis meters used correctly give you accurate readings. The difference is technique and time, not precision.

Professional building biologists often prefer single-axis meters because they want to understand the directionality of a field rather than just its total strength.

Knowing which direction a field is strongest coming from can tell you something useful about where the source is and how to address it. Instruments like the Gigahertz Solutions HF59B, which is widely used in building biology practice, are single-axis by design. A full review of that meter is coming to the site.

Which One Should You Buy

If you’re buying your first meter and want something you can pick up and use without thinking about technique, tri-axis magnetic field measurement is the friendlier starting point. The Trifield TF2 and how it handles real-world home testing covers exactly what that experience looks like in practice.

If RF measurement is your primary focus, axis count matters less than RF ceiling and frequency coverage. Most meters are single-axis for RF regardless of how they handle magnetic fields, so look at the RF range and sensitivity first.

Rotate First, Then Read

Whether you’re using a single-axis or tri-axis meter, the habit of rotating slowly and noting the peak before settling on a reading will serve you well.

For magnetic fields a tri-axis meter makes this unnecessary. For RF it matters regardless of which meter you’re using.

The readings above show exactly why that habit makes a difference. The highest number isn’t always where you expect it to be.
Leave a Comment

GQ EMF-390 Review: A Serious Meter for People Who Want More Than a Single Number

If you’ve already looked into EMF meters, you’ve probably come across the GQ EMF-390. It shows up in a lot of conversations, and for good reason. It measures all three types of EMF, it logs data over time, and it gives you a visual picture of RF activity that most meters in this price range simply don’t offer.

I’ve been using my GQ-390 EMF meter for a while now and I want to give you an honest picture of what this meter actually does well, where it has limits, and who it makes the most sense for.

Affiliate disclosure: I bought this meter myself. If you purchase through my link I may earn a small commission at no extra cost to you.

What the GQ EMF-390 Measures

The 390 covers all three EMF field types in one device. Magnetic fields (EMF) are measured in milligauss (mG) and come from appliances, wiring, and anything running on AC power. Electric fields (EF) are measured in volts per meter (V/m) and radiate from wiring inside walls, extension cords, and plug-in devices even when they’re not actively in use. RF power density is measured in mW/m² and covers wireless signals from routers, phones, smart meters, Bluetooth devices, and cell towers.

One thing worth knowing upfront: the 390’s magnetic and electric field measurements are functional, but RF is where this meter genuinely shines. If your primary interest is measuring wireless radiation from routers, phones, and other wireless devices, the 390 is built for that job.

What I Measured

I want to show you what this meter actually does in a normal home, so here are the readings I took at a few common sources.

Stove

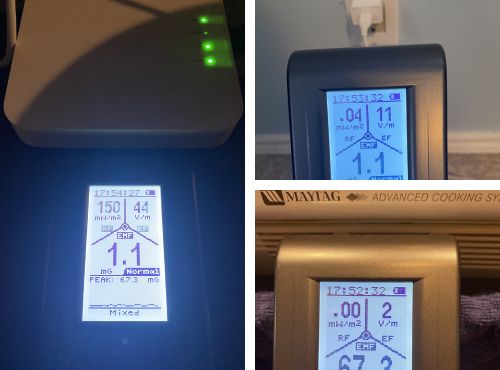
Right next to the stove, practically touching it, I measured 67.3 mG and 2 V/m. About a foot back that dropped to 5.3 mG and 1 V/m. At two feet back I was down to 2.1 mG and 1 V/m. That’s a pattern you’ll see with almost every large appliance: the field drops off quickly with distance. Two feet cut the magnetic field reading by about 97% compared to right at the surface.

Phone charger

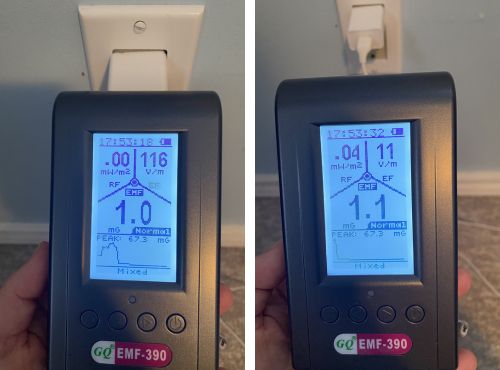
Right next to the charger I measured 116 V/m. About a foot away that fell to 11 V/m. Phone chargers are one of the more surprising sources of electric field in a typical bedroom, especially if yours sits on the nightstand while you sleep.

WiFi router

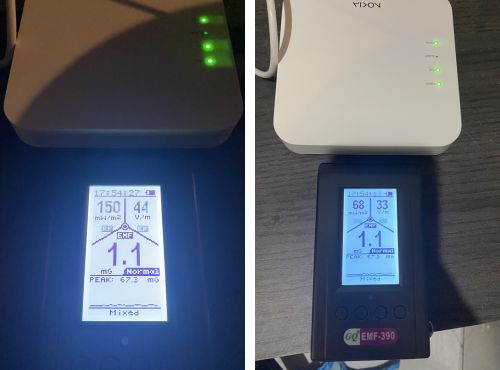
This is where the 390 showed me something I didn’t expect. I measured 68 mW/m² right next to the router, then took another reading at the same spot less than a minute later and got 150 mW/m². Same position, same router, big difference. That’s not the meter being inconsistent. That’s the router itself pulsing, and the 390 is catching it in real time.

Outside the room about eight feet away, the reading dropped to 0.0 mW/m². The RF essentially disappeared as soon as I left the room.

Phone

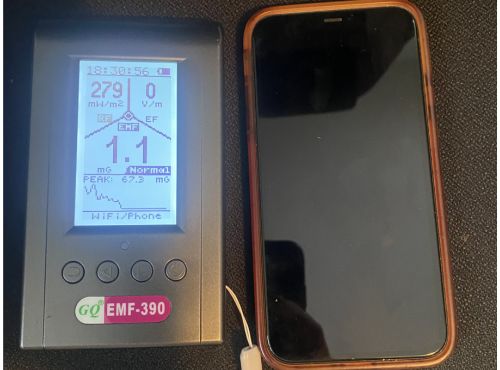
I ran a quick test with my phone to show how much the 390 can tell you about what your devices are actually doing. With cellular on I measured 675 mW/m².Switching to airplane mode with WiFi still on brought it down to 406 mW/m². True airplane mode with everything off dropped it to 0.00 mW/m². That sequence tells you something useful: airplane mode with WiFi enabled is not the same as full airplane mode, and the difference on the meter is significant.

GQ 390 EMF meter measuring RF cellular data

The RF Browser

One of the features that sets the 390 apart is the RF Browser. Instead of just showing you a single RF number, it displays a live visual of signal activity across frequencies so you can see what’s present in the environment, not just how strong the overall field is.

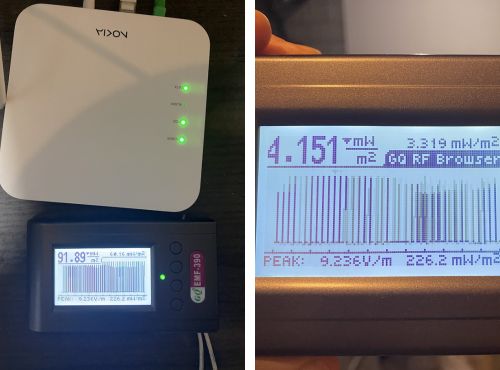
Right next to my router the RF Browser showed 91.89 mW/m² live with a peak of 226.2 mW/m². Outside the room at about eight feet back the live reading dropped to 4.151 mW/m² while the peak held at 226.2 mW/m², which is the highest reading captured during the session rather than the current live level. That distinction between live and peak is worth paying attention to when you’re using this feature.

Data Logging: The Feature That Changes How You Think About EMF

Most meters give you a snapshot. You hold it up, you read the number, you move on. The GQ EMF-390 does something different: it records readings continuously over time and lets you download that data to your computer as a CSV file.

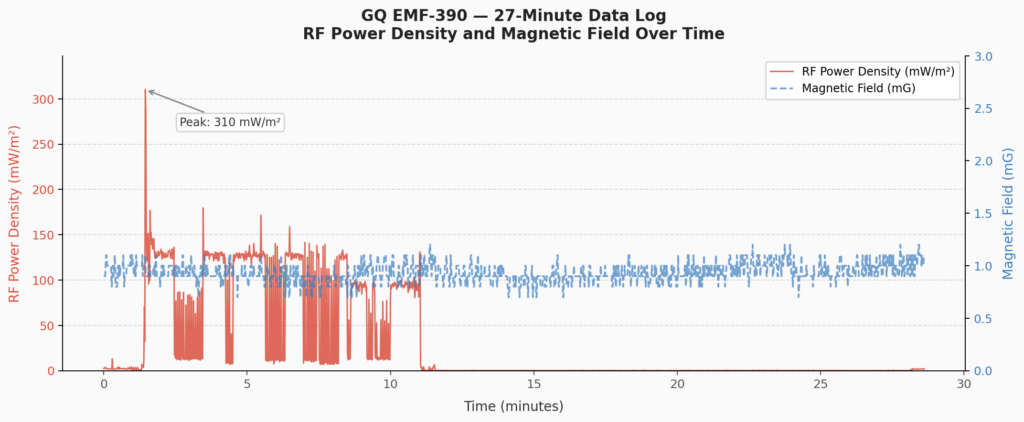
I ran a 27-minute logging session and the results were more interesting than I expected. For the first twelve minutes I was near my router. The RF readings were all over the place, peaking at 310 mW/m² and averaging around 67 mW/m² during that period. Then I left the room. The moment I walked out, RF dropped to essentially zero and stayed there for the remaining fifteen minutes of the session, averaging 0.114 mW/m².

What the graph shows you that a single reading never could: RF isn’t a fixed number. It varies constantly depending on where you are, what your devices are doing, and what’s happening on your network. A spot reading near your router might be 68 mW/m² one moment and 150 mW/m² the next. The logged data captures all of that variation and lets you see patterns you’d otherwise miss entirely.

The magnetic field reading stayed flat at around 0.9 mG for the entire 27 minutes regardless of where I was in the house, which is a useful baseline to have as well.

One honest note on setup: getting the logging software running on a Mac takes a few extra steps and isn’t as plug-and-play as the meter itself. You’ll need to download the CH341 USB driver and the GQ EMF Pro software separately from GQ’s download page. On newer Macs you may also need to approve the driver in System Settings under Privacy and Security before it will work. It’s not difficult once you know what you’re looking for, but it isn’t obvious out of the box.

The RF Spectrum Display

Alongside the RF Browser, the 390 also has an RF Spectrum display that shows signal activity broken down across the frequency range the meter covers. Where the RF Browser gives you a live power reading with peak tracking, the Spectrum display gives you a visual sweep of which frequencies are active. If you’re trying to identify what’s contributing to a reading in a space with multiple wireless sources, this is a genuinely useful tool. It’s the kind of feature you’d expect on a more expensive professional instrument.

Live Graph Mode

The 390 also displays a live scrolling graph of your readings on screen as you move through a space. It’s a nice visual and gives you a real-time picture of how readings change as you move closer to or further from a source. I’d call it a useful at-a-glance tool rather than an essential feature, but it adds to the sense that this meter is designed to give you more context, not just a number.

Pros and Cons

The GQ-390 rewards patience. The more time you spend with it, the more useful it becomes, and the data logging feature in particular changes how you think about EMF measurement once you’ve actually used it.

Pros

  • Measures magnetic fields, electric fields, and RF in one device
  • Data logging with CSV export gives you a complete picture of exposure over time
  • RF Browser and Spectrum display show frequency activity visually, not just a single power reading
  • Captures real-time RF variability that spot readings miss entirely
  • Covers RF frequencies up to 10 GHz, which includes 5G frequency ranges
  • Live graph display adds useful visual context
  • Priced competitively for what it offers

Cons

  • Magnetic and electric field measurement is functional but not the meter’s primary strength
  • RF is single-axis, meaning you need to rotate the meter to find peak readings
  • Data logging software for Mac requires a separate driver download and isn’t plug-and-play
  • The display and menu system have a learning curve compared to simpler meters

Who This Meter Is Right For

The GQ EMF-390 makes the most sense if you want to go beyond basic spot readings. If you’re the kind of person who wants to log readings overnight, map how RF levels change throughout your day, or see a visual breakdown of what frequencies are active in a space, this meter gives you tools to do all of that at a price point that doesn’t require a professional budget.

It’s also a strong choice if RF is your primary concern. The router, phone, and RF Browser readings I shared above give you a sense of what it can do. For someone focused on wireless radiation from everyday devices, the 390 delivers real data rather than just a number on a screen.

If you’re newer to EMF testing and want something straightforward to pick up and use without a learning curve, a simpler meter may be a better starting point. But if you’re ready to dig into the data, the 390 is worth it.

Check the current price on Amazon

What the Numbers Mean in Context

The readings I shared above are real and they come from a normal home. Some of them look high at first glance, especially the router and phone readings. Context matters here.

The ICNIRP regulatory limits for RF exposure sit far above anything a consumer meter will show you in a typical home environment. But regulatory limits were designed around short-term, high-intensity thermal effects, and they haven’t been substantially updated to reflect decades of research into long-term, low-level exposure. A separate set of guidelines from the International Institute for Building Biology and Ecology takes a more precautionary approach, with a general caution threshold of 100 µW/m² for RF in sleeping areas and 10 µW/m² for people who are more sensitive.

The NTP study and the Ramazzini Institute findings both found associations between RF exposure and biological effects at levels below current regulatory limits. The research is still developing, but there’s enough there that simple, proportionate steps make sense. Measuring first is the right place to start, and that’s exactly what a meter like this lets you do.

If you want to understand what your readings actually mean and how they compare to established benchmarks, I go through all of that in detail in what’s a normal reading on an EMF meter.

Not a doctor. Nothing here is medical advice. If you have specific health concerns, talk to a qualified professional.

Leave a Comment