If you’ve just picked up an EMF meter and aren’t sure what you’re looking at, this article is for you. Getting a reading is easy. Understanding what it’s telling you takes a little more context, and that’s exactly what this covers.
What Your Meter Is Actually Measuring
Before you interpret any number, it helps to know which field type you’re looking at. Most full-spectrum meters measure three different things and display them in three different modes.

Magnetic fields show up in milligauss (mG) or microtesla (µT). These come from appliances, wiring, and anything running on AC power. Electric fields show up in volts per meter (V/m). These radiate from cords and wiring even when devices aren’t actively running.
RF shows up in milliwatts per square meter (mW/m²) or microwatts per square meter (µW/m²). This covers wireless signals from routers, phones, smart meters, and cell towers.
If you need a full breakdown of what each unit means and how to convert between them, the EMF units guide covers all of that in plain language.
The Two Numbers You’ll See: Live and Peak
Most meters show two numbers at once and this confuses a lot of first-time users.
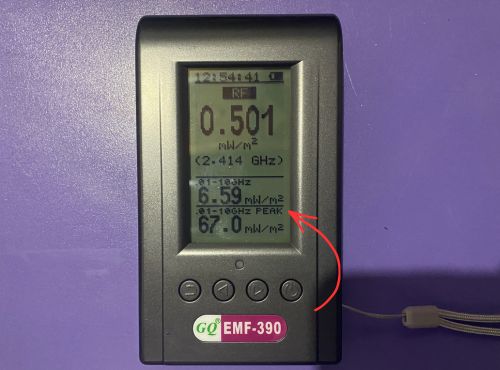
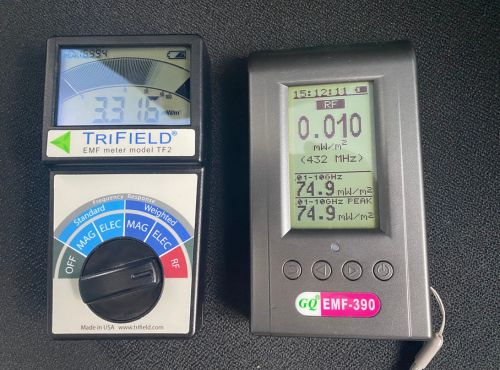
The live number is what the meter is detecting right now at this exact moment. The peak number is the highest reading the meter has captured during the current session. Note that meters handle peak reset differently. The Trifield TF2 resets its peak automatically after a short period. The GQ EMF-390 holds the peak until you manually reset it or the meter powers down. Check your specific meter’s behavior before relying on the peak number. If you haven’t settled on a meter yet, see our recommendations before you go further.
For magnetic fields the live number is usually sufficient. Magnetic fields from appliances and wiring are relatively stable and don’t fluctuate dramatically from moment to moment.
For RF the peak number is the one that matters most. Wireless devices don’t transmit continuously. They pulse, which means the live reading can catch the meter between pulses and show something much lower than what the source is actually putting out. Always note the peak when you’re measuring RF from a router, phone, or any wireless device.

Wait for the Reading to Settle
This is the most common mistake beginners make. When you first point the meter at a source, the numbers will jump around for a few seconds. Don’t read the first number you see.
Hold the meter steady, point it at the source, and wait three to five seconds for the reading to stabilize before you record anything. Moving the meter too quickly can also cause the numbers to spike momentarily from the motion itself rather than from the source you’re measuring.
For RF especially, let the meter run for at least ten seconds near a source before deciding on your reading. The pulsing nature of wireless signals means you need enough time to see the range of variation and let the peak number climb to a representative level.
Rotate to Find the True Peak
If you’re using a single-axis meter, or using the RF mode on any meter including the Trifield TF2, the angle you’re holding the meter at affects the reading you get.
Rotate the meter slowly through different orientations and watch the numbers as you do. The reading will climb in some positions and drop in others. The highest number you find across all orientations is your true peak reading for that source.
I tested this directly at three feet from my router, and you can see how the Trifield TF2 performs across different measurement scenarios in my full review. Pointing the meter directly at the router gave a peak of 9.4 to 9.6 mW/m² on the TF2. Rotating to face left the peak climbed to 16.6 to 19.1 mW/m². If I had stopped at the first reading I would have missed the true peak entirely.

Distance Changes Everything
The single most useful thing your meter can show you isn’t the reading itself. It’s how the reading changes as you move.
EMF fields drop off with distance from the source, and for most sources that drop-off is significant within just a few feet. Measuring at one distance and stopping there gives you an incomplete picture. The more useful habit is to take readings at the source, one foot back, and two feet back, then note where the reading drops to a level you’re comfortable with.
Here’s what that looks like from my own testing using the GQ EMF-390.
At the stove: 67.3 mG practically touching the surface, 5.3 mG at one foot, 2.1 mG at two feet. That’s a 97% reduction over two feet of distance.

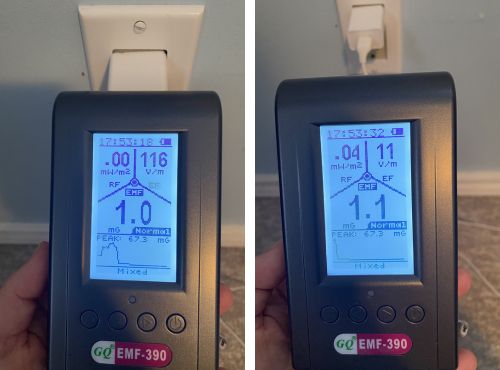
At a phone charger: 116 V/m right next to it, 11 V/m at one foot. Moving the charger to the other side of the nightstand is often all it takes to bring a bedroom reading down significantly.
At the router: 150 mW/m² at close range, essentially 0.0 mW/m² outside the room eight feet away. All three of those readings came from my hands-on testing of the GQ EMF-390 in my own home. The RF from a typical router drops to near background levels within one room.

What the Numbers Actually Mean
A reading by itself doesn’t tell you much without a reference point. There are two frameworks worth knowing about and they give very different answers.
Regulatory limits from ICNIRP and the FCC were established around short-term thermal effects, meaning how much energy it takes to heat body tissue. For RF, the ICNIRP limit sits at 10,000,000 µW/m², which is 10,000 mW/m². You will never approach that number with a consumer meter in a typical home. If regulatory compliance is your only concern, most home environments pass easily.
The Building Biology Evaluation Guidelines take a different approach. They were designed specifically for sleeping areas and apply a precautionary framework based on long-term low-level exposure rather than short-term heating effects. Their thresholds are meaningfully lower and are the reference point most EMF-aware individuals use when interpreting home readings.
Here’s a simple reference for sleeping areas using the Building Biology benchmarks.
Magnetic fields
Below 1 mG: low concern 1 to 4 mG: moderate, worth investigating sources Above 4 mG: elevated, take action to identify and reduce
Electric fields
Below 10 V/m: low concern 10 to 50 V/m: moderate Above 50 V/m: elevated, check wiring and cord placement
RF
Below 100 µW/m² (0.1 mW/m²): general precaution level Below 10 µW/m² (0.01 mW/m²): recommended for sensitive individuals
These benchmarks are precautionary, not regulatory. They reflect the judgment of building biology practitioners about what constitutes a reasonable low-exposure environment given the current state of research, not a government-mandated safety limit.
The ICNIRP guidelines haven’t been substantially updated to reflect decades of non-thermal research. The NTP study and the Ramazzini Institute findings both found biological associations at levels well below current regulatory thresholds. That body of evidence is part of why the precautionary benchmarks exist as a separate and more conservative reference point.
Where you land on that spectrum is your call. What the meter gives you is the information to make that decision based on what’s actually in your home rather than guesswork.
Reading Your Bedroom First
If you’re not sure where to start, start in the bedroom. You spend more time there than anywhere else in your home, and more of that time is during sleep when your body is in a restorative state. It’s the highest-value room to measure and the most actionable.
Check your nightstand first. Phone chargers, alarm clocks, and anything plugged in near where you sleep are worth measuring at the distance your body actually sits during sleep. Check the wall behind your headboard if you have outlets there. Then check the room more broadly for RF from any router or device in the adjacent room or hallway.
Measure, note what you find, and then decide if any simple changes make sense. Unplugging a charger, moving a device to the other side of the room, or switching your phone to airplane mode at night are low-effort steps that can make a measurable difference.
A Few Habits That Will Improve Every Reading You Take
Reset the peak reading before each new source so you’re not carrying over numbers from a previous measurement. Let the reading settle before you record it. Take at least three readings at each position and note the range rather than a single number. For RF, always record the peak not just the live reading. Move through orientations slowly rather than sweeping quickly.
None of this requires expertise. It just requires a little patience, and after a few sessions it becomes automatic.
What to Do When a Reading Is High
A high reading is information, not a verdict. The first question to ask is whether the source is something you spend significant time near. A high reading at the back of your stove matters less than a high reading at your pillow.
The second question is whether distance can solve it. For most home sources it can. Moving a device, rerouting a cord, or changing where you sit or sleep relative to a source is often enough to bring a reading down to a level you’re comfortable with.
For help choosing the right tool for what you’re trying to measure, how to pick the right EMF meter for your situation covers the key specs to compare before you spend any money.
I’m not a doctor. Nothing here is medical advice. If you have specific health concerns, talk to a qualified professional.