EMF Units Explained: What mG, V/m, and µW/m² Actually Mean

If you’ve looked at an EMF meter and seen a screen full of abbreviations, you’re not alone. The units EMF meters display aren’t complicated once you understand what each one is measuring, but they’re rarely explained in plain language. The NIEHS groups EMF into two categories by frequency: non-ionizing and ionizing. Understanding that split is the fastest way to make sense of what your meter is showing you. This article does exactly that. If you haven’t picked a meter yet, browse EMF meters for every budget before you dive in.

Why There Are Multiple Units

EMF is not one thing. The term covers three distinct types of fields, and each one is measured differently because each one behaves differently.

Magnetic fields, electric fields, and radiofrequency radiation are related but not the same. A meter that measures one isn’t necessarily measuring the others.

Once you understand which unit goes with which field type, the numbers on your meter start making sense immediately.

Magnetic Fields: milligauss (mG) and microtesla (µT)

Magnetic fields are measured in milligauss (mG) in the United States and microtesla (µT) in most of the rest of the world. The two units measure the same thing on different scales. One µT equals 10 mG, so if your meter displays µT and you want mG, multiply by 10.

Magnetic fields come from anything carrying electrical current: appliances, wiring inside your walls, power lines, and electrical panels. The field strength drops off quickly with distance, which is why a reading right next to your stove can be dramatically higher than a reading two feet back.

When I measured next to my stove with the GQ EMF-390, I got 67.3 mG practically touching the surface. Two feet back that was down to 2.1 mG. That’s a 97% drop over about two feet.

GQ EMF-390 showing 67.3 mG magnetic field reading next to kitchen stove

The Building Biology Evaluation Guidelines treat readings below 1 mG as a low concern level in sleeping areas, with readings above 4 mG considered elevated. These are precautionary benchmarks, not regulatory limits, but they give you a useful reference point when you’re interpreting what you find.

Electric Fields: volts per meter (V/m)

Electric fields are measured in volts per meter (V/m). Unlike magnetic fields, electric fields don’t require current to be flowing. They exist around any wire or device connected to a power source, even if nothing is actively running.

Unshielded lamp cords, extension cables, and wiring inside walls all produce electric fields whether a device is switched on or not. This is why the outlet above a headboard can produce a meaningful electric field reading even at midnight with nothing plugged into it.

Your body also conducts electricity, which means readings can vary slightly depending on whether you’re holding the meter or it’s sitting on a surface. For most home testing purposes that variation is minor but worth knowing.

A phone charger sitting on a nightstand is a good example of why electric fields are worth paying attention to. Right next to the charger I measured 116 V/m. About a foot away that dropped to 11 V/m. The charger doesn’t have to be actively charging anything to produce that field.

GQ EMF-390 measuring electric field from phone charger at 116 V/m

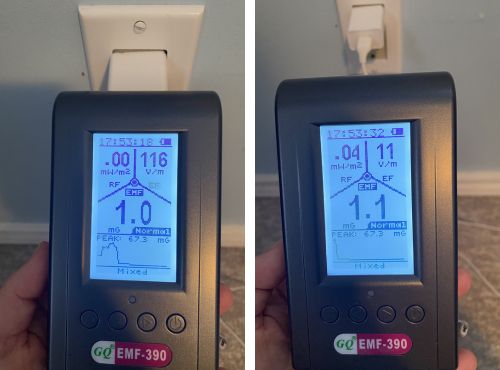
The Building Biology Guidelines suggest below 10 V/m as a low concern level in sleeping areas, with readings above 50 V/m considered elevated. Moving a device or rerouting a cord is often all it takes to bring a reading down significantly.

RF: µW/m², mW/m², and V/m

Radiofrequency radiation is where the unit situation gets a little more involved, because different meters display RF in different units and they’re all measuring the same thing on different scales.

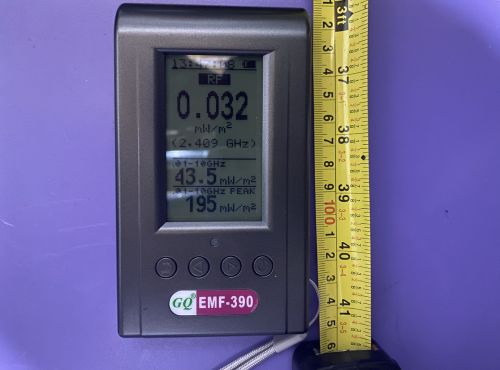
The most common units you’ll see are microwatts per square meter (µW/m²), milliwatts per square meter (mW/m²), and volts per meter (V/m) used as an RF field strength measurement. Converting between them is straightforward. One mW/m² equals 1,000 µW/m², so if your meter reads 2.5 mW/m² and you want µW/m², multiply by 1,000 to get 2,500 µW/m².

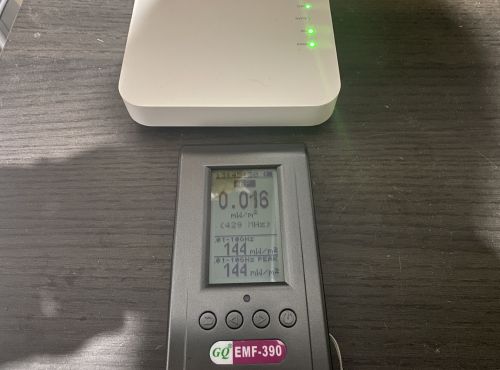
RF comes from WiFi routers, cell phones, smart meters, Bluetooth devices, baby monitors, and cell towers. Unlike magnetic fields, RF doesn’t drop off in a simple predictable pattern. It reflects off walls, passes through some materials more easily than others, and varies constantly depending on what devices on your network are doing.

A reading at one moment near your router can look very different from a reading taken a minute later at the same spot. When I tested my router at close range I measured 68 mW/m², then took another reading less than a minute later from the same position and got 150 mW/m². Same router, same spot, very different numbers.

GQ EMF-390 RF screen showing 150 mW/m² reading next to WiFi router

The Building Biology Guidelines suggest below 100 µW/m² as a general precaution threshold for sleeping areas, and below 10 µW/m² for people who are more sensitive. For context, current ICNIRP regulatory limits sit far above those levels, but those limits were established around short-term thermal effects and haven’t been substantially updated to reflect the body of research on long-term low-level exposure.

The NTP study and the Ramazzini Institute findings both found biological associations at levels well below current regulatory thresholds, which is part of why the precautionary benchmarks exist as a separate reference point.

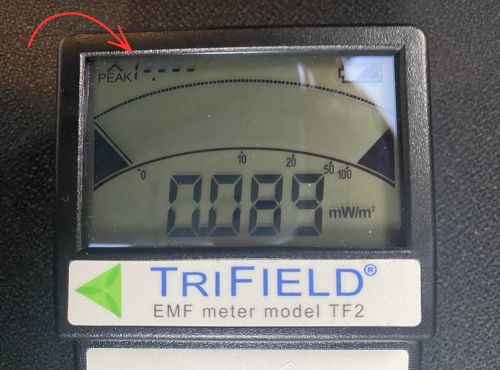
Peak vs. Average Readings

Most meters give you both a live reading and a peak reading. The live number is what the meter is detecting right now. The peak number is the highest reading captured since you last reset it.

For RF in particular, the peak reading is the more useful number. RF from a router or phone isn’t constant. It spikes when data is being transmitted and drops when the device is idle.

A live reading might catch the meter between pulses and show something deceptively low. The peak reading tells you what the actual high point was.

GQ EMF-390 RF screen showing peak reading of 67.0 mW/m² from WiFi router

When I’m testing RF sources I always note the peak, not just whatever the live display shows at the moment I happen to look at it. That habit alone will give you a much more accurate picture of what a source is actually putting out.

A Note on Units Across Different Meters

Not all meters use the same units for the same field type, which can cause confusion when you’re comparing readings between devices.

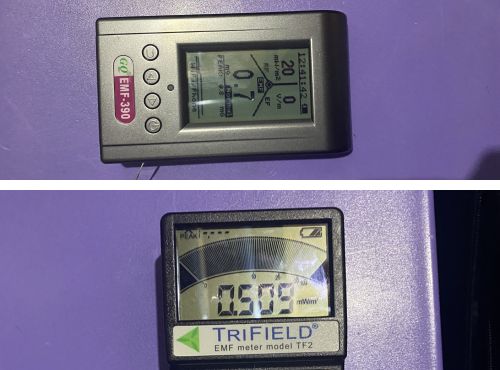
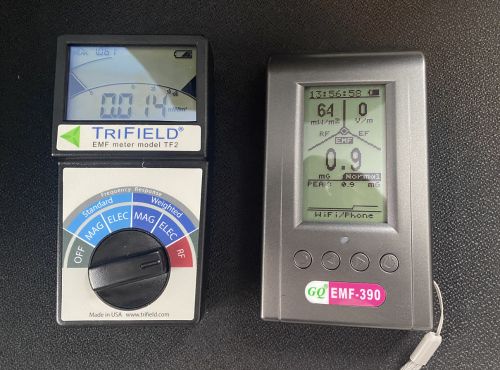
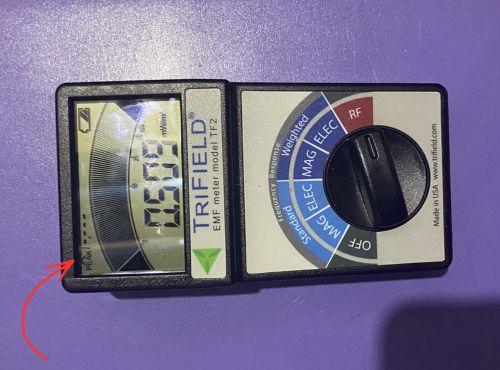
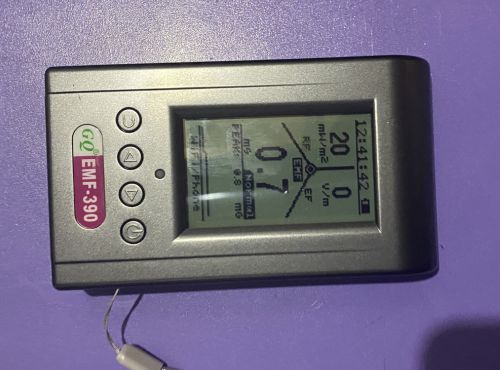
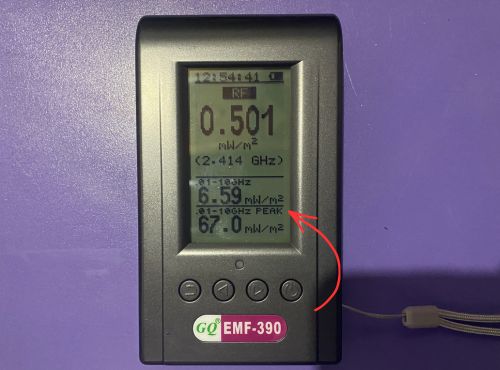
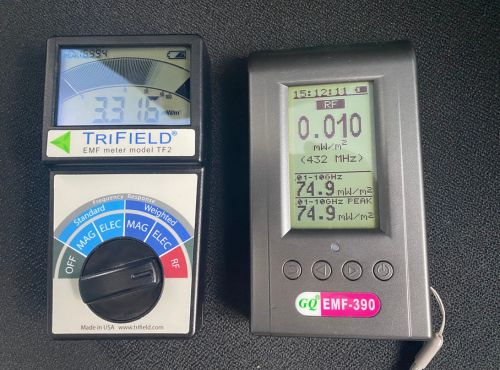
The Trifield TF2 displays RF in mW/m². The GQ EMF-390 RF screen shows readings in mW/m² as well, but also displays a narrow band reading tied to a specific frequency alongside the broadband figure. Some meters display magnetic fields in µT instead of mG. Some RF meters display in V/m rather than mW/m².

The readings are measuring the same things. The units are just different languages for the same information. Keep the conversion factors handy until they become second nature: 1 µT equals 10 mG, and 1 mW/m² equals 1,000 µW/m².

Trifield TF2 and GQ EMF-390 RF display screens side by side showing mW/m² readings

Putting the Units Together

Most full-spectrum meters display all three field types and switch between them as you change modes. Once you know which unit belongs to which field type, reading the display becomes intuitive.

mG or µT tells you about magnetic fields from wiring and appliances. V/m in electric field mode tells you about fields from cords and wiring. µW/m² or mW/m² tells you about wireless radiation from routers, phones, and other RF sources.

The units are just the language the meter uses to describe what it found. Understanding them takes about five minutes, and after that the numbers stop feeling abstract and start telling you something useful about the spaces you spend time in.

For a closer look at what real-world readings look like across common household sources, my full breakdown of the Trifield TF2 includes measurements from my own home with actual numbers

I’m not a doctor. Nothing here is medical advice. If you have specific health concerns, talk to a qualified professional.

Leave a Comment

Single-Axis vs. Tri-Axis EMF Meters: Which One Do You Actually Need?

When you start shopping for an EMF meter, you’ll run into the terms single-axis and tri-axis fairly quickly. Most listings mention one or the other without explaining what the difference means in practice. This article clears that up so you can make a straightforward decision before you buy. If you haven’t chosen a meter yet, start with the best EMF meter options first.

GQ EMF-390 positioned in front of WiFi router for RF measurement testing

The Core Difference

A tri-axis meter measures EMF on three planes simultaneously: left to right, front to back, and up and down. It combines those three readings internally and gives you a single number that reflects the total field strength regardless of how you’re holding the meter.

A single-axis meter measures on one plane at a time. To find the true peak reading you need to rotate the meter slowly through different orientations until the number stops climbing. The highest reading you find is your actual measurement.

It takes a little more technique but it’s not complicated once you’ve done it a few times.

What This Means When You’re Testing

For magnetic field measurements the difference matters most. Magnetic fields radiate in all directions from a source, so the angle you’re holding the meter affects what you read. A tri-axis meter handles this automatically.

With a single-axis meter you need to be deliberate about rotating to find the peak. Otherwise you can easily underread a source without realizing it.

For RF the distinction plays out differently. RF from a router or phone doesn’t radiate equally in all directions. The EPA notes that RF energy decreases as it travels and varies based on the direction and distance from the transmitter, which is exactly why a single-axis meter will give you meaningfully different readings depending on which way you’re pointing it.

I tested this directly with my router streaming video, taking readings at three feet in four orientations with both my Trifield TF2 and my GQ EMF-390. Neither meter gave its highest reading pointing directly at the router.

Trifield TF2 and GQ EMF-390 highest RF readings by orientation

The GQ peaked on its broadband live reading facing left at around 10 to 11 mW/m², compared to roughly 5 mW/m² pointing straight at the router. The TF2 hit its highest peak facing left as well, with readings up to 19.140 mW/m² compared to 9.388 to 9.640 mW/m² facing the router directly.

That’s not the meters being inconsistent. That’s single-axis behavior working exactly as it should, revealing that RF energy from your router isn’t coming at you equally from every direction.

An Important Clarification About the Trifield TF2

This is where a lot of people get confused. The Trifield TF2 is tri-axis for magnetic fields only. Its RF mode is single-axis, the same as the GQ EMF-390 and most other meters in this class.

If you’re testing RF with the TF2 you need to rotate it to find the peak reading just like any other single-axis meter. The tri-axis advantage disappears the moment you switch to RF mode.

Trifield TF2 RF display showing peaked out reading above 19.999 mW/m² ceiling

The TF2’s RF mode also has a maximum ceiling of 19.999 mW/m². During my directional testing the TF2 peaked out entirely on the facing-left orientation, meaning the signal exceeded what the meter can display. For a fuller picture of how the two meters compare on RF, my hands-on testing of the GQ EMF-390 goes into detail on where each meter’s RF capability begins and ends.

For magnetic and electric field work at power-line frequencies the TF2 is excellent. For RF from modern wireless devices at close range, a meter with a higher RF ceiling gives you more complete data.

When Two Meters Show Very Different Numbers

Here’s something worth understanding if you’ve ever held two meters side by side and gotten very different RF readings at the same spot. Part of the explanation is sensitivity and RF ceiling as described above. But part of it is simply orientation.

Both meters are single-axis for RF. If they’re positioned differently relative to the source, even by a few inches or a slight angle, they can give meaningfully different readings at the same moment.

Trifield TF2 RF display showing peaked out reading above 19.999 mW/m² ceiling

This is also why a controlled test with one meter at a time, at a fixed measured distance, with a consistent orientation, gives you more reliable comparison data than holding both meters up simultaneously and reading whatever appears on screen.

What the Numbers Actually Look Like

Here’s what I measured at three feet from my router across four orientations while streaming video. The TF2 displays two numbers: the highest reading captured since the last reset (peak) and what it’s detecting right now (live). The GQ RF screen shows a broadband live reading across its full frequency range.

GQ EMF-390 RF screen showing broadband live reading three feet from WiFi router

Trifield TF2 — Peak Reading by Orientation (mW/m²)

OrientationPeak
Facing router9.4 to 9.6
Facing left16.6 to 19.1*
Facing right9.9 to 10.5
Facing backward11.6 to 12.2

*One reading exceeded the TF2’s 19.999 mW/m² ceiling and peaked out.

Trifield TF2 display peaked out during facing left orientation test at three feet from router

GQ EMF-390 — Broadband Live Reading by Orientation (mW/m²)

OrientationBroadband Live
Facing router4.96 to 5.59
Facing left9.69 to 11.4
Facing right13 to 20
Facing backward3.84 to 9.18
GQ EMF-390 showing 20 mW/m² broadband live reading facing right during directional router test

Both meters were positioned three feet from the router while streaming video. Each orientation was tested three times five seconds apart. Neither meter gave its highest reading pointing directly at the source.

Both meters show the same pattern: the highest readings don’t come from pointing directly at the source. If you had taken one reading pointing straight at the router and stopped there, you would have missed the true peak on both meters. That’s the single-axis lesson in real numbers.

Does Tri-Axis Always Win

Not necessarily. Tri-axis is more convenient for magnetic field testing and removes the technique requirement entirely, which matters if you’re new to testing.

But single-axis meters used correctly give you accurate readings. The difference is technique and time, not precision.

Professional building biologists often prefer single-axis meters because they want to understand the directionality of a field rather than just its total strength.

Knowing which direction a field is strongest coming from can tell you something useful about where the source is and how to address it. Instruments like the Gigahertz Solutions HF59B, which is widely used in building biology practice, are single-axis by design. A full review of that meter is coming to the site.

Which One Should You Buy

If you’re buying your first meter and want something you can pick up and use without thinking about technique, tri-axis magnetic field measurement is the friendlier starting point. The Trifield TF2 and how it handles real-world home testing covers exactly what that experience looks like in practice.

If RF measurement is your primary focus, axis count matters less than RF ceiling and frequency coverage. Most meters are single-axis for RF regardless of how they handle magnetic fields, so look at the RF range and sensitivity first.

Rotate First, Then Read

Whether you’re using a single-axis or tri-axis meter, the habit of rotating slowly and noting the peak before settling on a reading will serve you well.

For magnetic fields a tri-axis meter makes this unnecessary. For RF it matters regardless of which meter you’re using.

The readings above show exactly why that habit makes a difference. The highest number isn’t always where you expect it to be.

Leave a Comment