Category: EMF Meters

Trifield TF2 Review: The Best First EMF Meter for Most People

I’ve been using the Trifield TF2 as my primary home testing meter for years. It was the first meter I ever bought, and after testing a lot of other options since then, it’s still the one I reach for first when I’m walking through a room I haven’t measured before. That’s not a small endorsement.

This review is going to tell you exactly what the TF2 does well, where it falls short, and who it’s actually right for. Because it’s not the right meter for everyone, and I’d rather you know that upfront than spend money on something that doesn’t fit what you’re trying to do.

If you already know you want it, you can check the current price here. Otherwise, keep reading.

Affiliate disclosure: I bought this meter myself. If you purchase through my link I may earn a small commission at no extra cost to you.
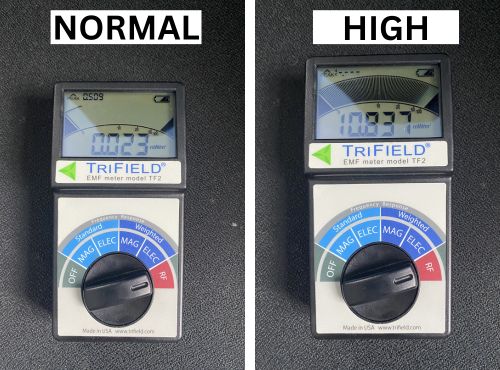
normal vs high reading on EMF meter

What the Trifield TF2 Is

The Trifield TF2 is a three-in-one meter made by AlphaLab, a US-based scientific instrument manufacturer. It measures all three types of EMF you’re likely to encounter in a home: AC magnetic fields, AC electric fields, and RF radiation. That combination in a single handheld device, at this price point, is what made it the go-to recommendation for home testing and still does.

It runs on a standard 9V battery, comes with a soft carry case, and weighs just under a pound. The display is backlit and readable in dim rooms, and it updates quickly enough to catch fluctuations as you move through a space. There’s also an audible alert that beeps in proportion to the field strength, which is genuinely useful when you’re walking slowly through a room and want to keep your eyes off the display. You can follow the sound to the source.

The manufacturer is AlphaLab, the same company behind professional-grade gaussmeters used in research settings. The TF2 is their consumer-facing product, and you can feel that it was designed by people who understand measurement instruments rather than by a marketing team trying to capitalize on EMF anxiety.

What It Measures and How Well It Does It

The TF2 covers the three field types that matter most for home testing. Here’s how it performs on each one.

AC Magnetic Fields. This is where the TF2 genuinely excels. The magnetic field mode is 3-axis, meaning it takes simultaneous readings from three directions and gives you a combined result. You don’t have to rotate the meter to find the peak reading the way you do with single-axis meters. You just hold it steady and read the number. The range runs from 0.1 to 100 mG, which covers everything you’re realistically going to encounter in a home, from background levels in the 0.1 to 0.5 mG range up through appliance readings that can push well into elevated territory right at the source.

In my experience, the magnetic field readings on the TF2 are reliable and consistent. When I’ve compared the same spot to readings from other quality meters I own, the numbers are in the same range. That cross-referencing matters more than any spec sheet when it comes to trusting a consumer meter.

The stove photo below is a good example of what the magnetic field mode shows you in a real home. Right up against the stove I measured over 80 mG. A foot or two back, it dropped to essentially zero.
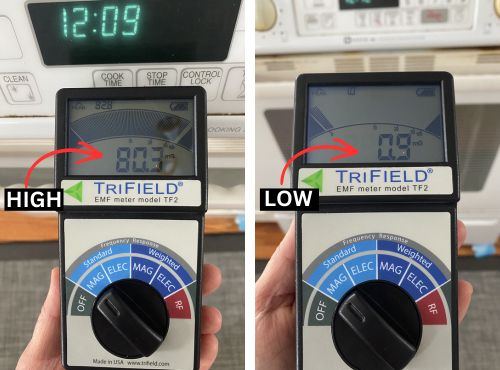
high vs low magnetic fields measurements with my trifield EMF meter

That’s one of the most useful things about the TF2’s magnetic mode: the readings respond immediately and dramatically to distance, so you can actually track a field back to its source and figure out exactly where it drops to an acceptable level.

AC Electric Fields. The electric field mode covers 1 to 1,000 V/m, which is more than enough range for home testing. The mode is single-axis, so you do need to be a bit more deliberate about orientation when measuring, but for most home use this isn’t a significant limitation. The readings respond quickly and the peak hold function is useful for catching momentary spikes near wiring.

I use this mode regularly in the bedroom, particularly around the headboard area where outlet wiring is often closer than people realize. The photo below shows exactly what I mean. Measuring practically at the outlet above my headboard with the TF2, I got 508 V/m. Two feet back it dropped to 6 V/m. Same outlet, same lamp, just distance.

high vs low electric field reading using my Trifield EMF meter

RF Radiation. The RF mode covers 20 MHz to 6 GHz, which includes Wi-Fi, Bluetooth, cell signals, and most 5G frequencies used in residential areas. The range runs from 0.001 to 19.999 mW/m², which is broader than many consumer meters and means you’re less likely to hit the ceiling in typical home environments.

There are two things to understand about the RF mode before you use it. First, the TF2 displays RF in mW/m², while most building biology guidelines use µW/m². You multiply the TF2 reading by 1,000 to convert. It’s simple once you know it, but it catches a lot of beginners who compare their reading directly to a benchmark without converting. This is standard across most consumer meters at this price range, not a quirk specific to the TF2.

Second, the RF mode is single-axis, which means orientation matters when you’re pointing it at a source. This is also true of comparable meters including the GQ EMF-390, so it’s not a disadvantage unique to the TF2, just something to be aware of.

Because Wi-Fi signals pulse rather than transmit continuously, the live display window can look deceptively calm between pulses. The peak hold reading is what actually tells you what you’re dealing with. When I measured my old conventional router up close, the meter was peaking out entirely, exceeding its maximum RF range of 1.999 mW/m². Eight feet back, the peak settled at 1.49 mW/m². That’s the kind of real-world context the TF2 gives you once you know how to read it.
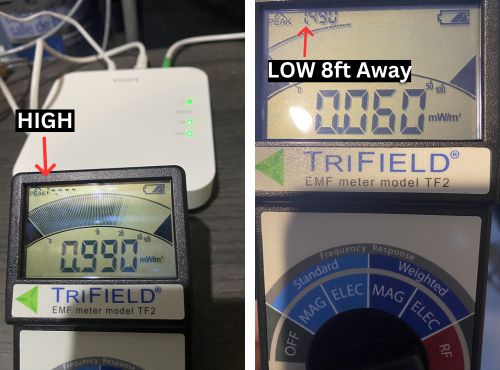
high vs low RF radiation measurement from my wireless router

For most home testing purposes, the RF mode is useful and informative. If RF is your primary concern and you want calibration documentation alongside your reading, the Safe and Sound Pro II is worth looking at, though it’s worth knowing that meter measures RF only. It’s not an alternative to the TF2. It’s a complement to it for people who want a dedicated RF instrument alongside an all-in-one meter.

The Standard vs. Weighted Mode Question

The TF2 has two measurement modes for magnetic and electric fields: standard and weighted. This confuses a lot of people, including me when I first got the meter.

Standard mode measures the actual field strength as it is, flat across the frequency range. Weighted mode applies a filter that emphasizes certain frequencies based on older thinking about which parts of the EMF spectrum are most biologically relevant. The weighted mode will often produce a higher number on the same source.
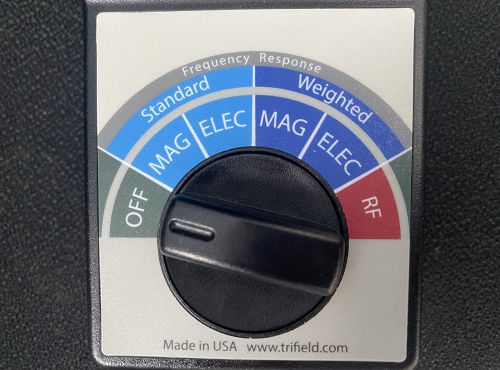
For home testing and comparing your readings to building biology benchmarks, use standard mode. The Institute for Building Biology and Ecology guidelines were developed using standard, unweighted measurements. If you measure in weighted mode and then compare to those thresholds, you’re comparing apples to oranges. I cover this in much more detail, including exactly when weighted mode is and isn’t useful, in the dedicated guide to Trifield TF2 standard vs. weighted mode.

What the TF2 Does Not Do

It does not measure dirty electricity. This isn’t a weakness specific to the TF2. No handheld EMF meter measures dirty electricity. It’s a fundamentally different type of measurement that requires a plug-in filter meter like the Greenwave or Stetzer. If dirty electricity is part of what you want to assess, that’s a separate tool regardless of which EMF meter you buy.

It does not data log. The GQ EMF-390 is my second meter specifically because it records readings over time and lets me see patterns rather than snapshots. If you want to know what the RF levels in your bedroom look like over an entire night while you sleep, the TF2 can’t tell you that.

Pros and Cons

Pros:

  • Measures all three field types in one device
  • 3-axis magnetic field measurement, no rotation needed
  • Broad RF range up to 6 GHz, covers most 5G frequencies
  • Built by a legitimate scientific instrument manufacturer
  • Peak hold function on all modes
  • Backlit display, easy to read
  • Audible alert that responds proportionally to field strength, useful for tracking sources without watching the display
  • Made in the USA
  • Solid build quality for the price

Cons:

  • RF mode is single-axis, requires deliberate orientation (standard for meters in this class)
  • RF displayed in mW/m², requires conversion to compare to standard benchmarks (standard for meters in this class)
  • No data logging
  • Does not measure dirty electricity (true of all handheld EMF meters)
  • Weighted mode causes confusion for new users
  • RF sensitivity maxes out at 1.999 mW/m² peak, which close-range router testing can exceed

Check the current price here.

Who the Trifield TF2 Is Right For

It’s the right first meter for most people who want to understand the EMF environment in their home. If you’re starting from zero and you want a single device that lets you walk through every room and measure what’s actually there, the TF2 is what I’d recommend. It’s what I started with, and if I were buying my first meter today I’d buy it again.

It’s also a strong choice if magnetic and electric field testing is your primary focus. The 3-axis magnetic mode in particular is genuinely better than most consumer meters at this price.

It’s not the right only meter if RF is your primary concern and you want data logging and spectrum analysis. That’s exactly why I added the GQ EMF-390 as my second meter. The two together cover everything I need for thorough home testing. The TF2 is a strong foundation, and you can build from there based on what your testing actually shows you.

The price sits in the $160 to $200 range depending on where you buy it. Check the current price here. For what you get, that’s fair. There are cheaper meters. There are also meters that do individual things better. But for an all-in-one starting point that’s actually built by people who make scientific instruments, the TF2 earns its place as the default recommendation.

Frequently Asked Questions

A few of the questions I hear most often from people deciding whether the TF2 is the right meter for them, or trying to figure out how to use it once they have it.

Is the Trifield TF2 accurate enough for home testing?

Yes. For the purpose of walking through your home, identifying elevated areas, and taking before-and-after readings to see whether a change you made moved the numbers, the TF2 is accurate enough. It’s consistent, and consistency is what matters most for practical home testing. I’ve cross-referenced readings with other quality meters I own and the results are reliably in the same range.

What’s the difference between standard and weighted mode, and which should I use?

Standard mode measures actual field strength across the frequency range. Weighted mode applies a filter that emphasizes certain frequencies that were once thought to be most biologically significant, and it often produces higher readings on the same source. For home testing and comparing to building biology benchmarks, always use standard mode. The precautionary guidelines you’re comparing your readings to were developed using standard measurements. If you want the full picture on what weighted mode is actually doing and when it changes anything, I break it all down in Trifield TF2 standard vs. weighted mode.

Does the Trifield TF2 measure 5G?

It measures RF up to 6 GHz, which covers the sub-6 GHz 5G frequencies used by most current residential 5G deployments. It does not cover millimeter wave 5G frequencies above 6 GHz, which are primarily used in dense urban environments and some fixed wireless applications rather than typical residential settings.

Do I need a second meter alongside the TF2?

For a general home assessment covering all three field types, the TF2 alone is enough to get started. If you want to data log RF levels over time, you’d need something like the GQ EMF-390. If you want calibration-certified RF readings with a dedicated instrument, add the Safe and Sound Pro II. The TF2 is a strong foundation, and for most people starting out, it’s all they need for the first round of testing.

What battery does the Trifield TF2 use?

A standard 9V battery. One comes included in the box. Battery life is reasonable for intermittent home testing use, though if you’re doing extended measurement sessions you’ll want to keep a spare on hand.

Why does my live RF reading look so low when I know my router is nearby?

Because Wi-Fi signals pulse rather than transmit continuously. The live display window catches the signal between pulses and can look much lower than the actual peak output. Always use the peak hold reading when measuring RF from pulsing sources like Wi-Fi routers. That’s the number that reflects what the meter actually captured at maximum output.

Start Here, Then Go Deeper

The TF2 is the meter I used to take the readings referenced throughout this site, including the stove measurements in the magnetic field benchmarks article and the router readings in the RF section. It’s not a perfect meter, but it’s a real one, made by people who know what they’re doing, and it gives you genuinely useful information about your home.

If you’re ready to start testing, the home testing guide walks you through a room-by-room process using the TF2 as your primary instrument, including what to measure, where to hold the meter, and how to interpret what you find.


Leave a Comment

What’s a Normal Reading on an EMF Meter?

If you’ve just picked up an EMF meter and looked at the display, there’s a good chance your first question is: is this reading high or low? The numbers can seem abstract without a reference point, and that’s exactly what this article is here to give you.

The short answer is that there’s no single universal definition of “normal.” But there are two very different frameworks for evaluating what your meter shows you, and understanding the gap between them is arguably more useful than any specific number. If you’re still deciding which meter to use for this, see the top EMF meters compared first.

Let me break it down by field type, explain where each set of guidelines comes from, and give you a clear picture of where the science actually stands.

Two Very Different Sets of Standards

Before we get to numbers, you need to understand something that trips a lot of people up. There are two completely different frameworks for evaluating EMF readings, and they produce thresholds that are sometimes millions of times apart.

Regulatory limits are set by organizations like ICNIRP and the FCC. These define the maximum exposure permitted under current international standards. The problem is that they are based almost entirely on thermal effects, meaning the level at which EMF can heat tissue.

They were largely established in the 1990s and have not been substantially updated to reflect decades of research into non-thermal biological effects. When your readings fall below regulatory limits, that tells you one thing: the signal probably isn’t cooking you. It doesn’t tell you much beyond that.

Precautionary guidelines are set by building biologists and environmental health researchers, most notably through the Institute for Building Biology and Ecology. These are not legally binding, but they are grounded in a broader reading of the available science, including research on non-thermal effects that regulatory bodies have been slow to incorporate. They are considerably more conservative, and in my view, considerably more useful as a practical reference for your home.

The gap between these two frameworks isn’t just a difference of opinion. It reflects a real and ongoing dispute in the scientific community about how EMF exposure should be evaluated. More than 400 scientists and medical doctors have signed the International EMF Scientist Appeal, calling on the WHO and UN to adopt stronger protections based on the existing body of research. These are not fringe voices. They are researchers who have spent careers studying this and believe the current regulatory limits don’t reflect what the science is showing.

This pattern isn’t without precedent. Regulatory bodies have historically lagged behind the science on environmental health issues, lead and asbestos being the most cited examples. That doesn’t mean EMF is the next asbestos. It means that waiting for regulatory certainty before taking simple, low-cost precautions is not necessarily the cautious choice.

The precautionary principle exists for exactly this situation: when the evidence is uncertain but the potential consequences are meaningful, it makes sense to act on what we know rather than wait for what we don’t. That’s the framework this article uses.

A note on where I stand: I’m not a doctor, and nothing here is medical advice. I’m not going to tell you EMF is definitely harmful at typical home levels, because the science doesn’t conclusively say that. What I will say is that the regulatory limits were not designed with your long-term health as the primary variable, and the researchers calling for stronger protections deserve to be taken seriously. Taking simple steps to reduce exposure in the places where you spend the most time strikes me as reasonable given what we currently know.

Normal Magnetic Field Readings

Magnetic fields are measured in milligauss (mG) and are produced by current flowing through wires. Every electrical appliance, power line, and piece of wiring in your home creates a magnetic field. Your meter’s magnetic field mode is what you use to measure these.

Precautionary benchmarks for magnetic fields:

  • Below 1 mG: low, considered acceptable in sleeping areas
  • 1 to 4 mG: moderate, worth investigating the source
  • Above 4 mG: elevated, worth taking action to reduce if possible

In a typical home, most areas away from appliances will read below 1 mG. You’ll often see higher readings close to running appliances, near the electrical panel, and in spots where wiring runs through the wall.

When I walk around my house with the Trifield TF2, most open rooms away from appliances read somewhere between 0.1 and 0.5 mG. Right next to the stove, I’ve measured over 80 mG. A foot or two back, it drops to essentially nothing. Distance matters a lot with magnetic fields.

The sleeping area focus in these benchmarks isn’t arbitrary. Magnetic fields drop off quickly with distance, which means the appliances you run briefly during the day are rarely the ones worth worrying about. What matters more is what’s close to you for hours at a time. A lamp plugged in behind the headboard or wiring running through the wall beside your bed is a different calculation than the stove you stand near for a few minutes while cooking.

Unit note: The Trifield TF2 reads magnetic fields in milligauss (mG). If you’re using a meter that shows microtesla (µT), multiply by 10 to convert to mG. So 0.1 µT equals 1 mG.

Normal Electric Field Readings

Electric fields are measured in volts per meter (V/m) and are produced by voltage in wires, even when no current is flowing. A lamp that’s plugged in but turned off still produces an electric field. This is one of the reasons building biologists pay particular attention to sleeping areas, where you may be within a few feet of in-wall wiring for hours at a time.

Precautionary benchmarks for electric fields:

  • Below 10 V/m: low, considered acceptable in sleeping areas
  • 10 to 50 V/m: moderate, worth considering changes
  • Above 50 V/m: elevated, building biologists typically recommend action

Electric field readings are often higher near the bed headboard if there’s wiring in the wall behind it, or near extension cords and power strips on the nightstand. Switching off circuits at the breaker while you sleep is one of the most effective steps you can take for electric field reduction in the bedroom, and it costs nothing.

I tested this in my own bedroom with the Trifield TF2. There’s an outlet on the wall above my headboard with a lamp plugged in. Measuring practically at the outlet, I got 508 V/m with a peak of 538. That’s well into the elevated range. About a foot back, it was down to 22 V/m. At two feet, it dropped to 6 V/m with a peak of 7, which sits comfortably in the low range.

Two feet of distance, no cost, and the reading went from elevated to low. If you can’t move the outlet, you can unplug the lamp before bed, push the bed frame a few inches further from the wall, or switch off that circuit at the breaker. Any of those options gets you the same result.

The sleeping area focus in these benchmarks isn’t arbitrary. It’s about cumulative exposure time. Eight hours a night in close proximity to an elevated electric field adds up in a way that a brief exposure during the day doesn’t. That’s the logic behind applying the most conservative benchmarks to the places where you sleep.

Normal RF Radiation Readings

RF radiation is measured in microwatts per square meter (µW/m²) and is what your meter detects from Wi-Fi routers, phones, smart meters, and other wireless devices. This is the reading that tends to vary the most depending on where you live and how many wireless devices are in and around your home.

Precautionary benchmarks for RF:

  • Below 10 µW/m²: recommended for sleeping areas, especially for sensitive individuals
  • Below 100 µW/m²: general precautionary benchmark for most people
  • 100 to 1,000 µW/m²: elevated, worth reducing where possible
  • Above 1,000 µW/m²: high, building biologists typically recommend action

For context, ICNIRP’s regulatory limit for RF at typical Wi-Fi frequencies sits around 10,000,000 µW/m² (that’s 10,000 mW/m² on a meter that displays in mW/m²). The precautionary benchmarks are not slightly more conservative. They are orders of magnitude more conservative. That gap exists because the precautionary guidelines are trying to answer a different question: not “at what level does this definitely cause harm” but “how low can we reasonably get given what we know.”

A note on how to read RF on your meter. When you’re measuring a Wi-Fi router, you’ll notice the standard display window jumping around constantly, often showing a reading that seems low or even near zero between pulses. That’s not a malfunction. Wi-Fi signals don’t transmit continuously. They pulse, and the gaps between pulses can make the live window look misleadingly calm. The number that actually tells you what you’re dealing with is the peak hold reading, which captures the highest value recorded since you started measuring. That’s the figure worth paying attention to.

I tested this with my Trifield TF2 next to a conventional router, before I switched to the JRS Eco. Standing close to the router, the meter was peaking out entirely. The Trifield TF2 has a maximum RF range of 1.999 mW/m², and the signal was exceeding that ceiling. The standard display window was showing 0.990 mW/m², which is the top of its live measurement range, while the actual signal was higher than the meter could register.

I had to move back to at least eight feet before the peak hold reading finally stopped maxing out. At that distance I was reading 1.49 mW/m² peak with a standard window reading of 0.060 mW/m², which converts to roughly 1,490 µW/m² peak. That’s above the elevated threshold in the precautionary guidelines, and that was eight feet away.

The practical takeaway is straightforward. Keep your router out of the rooms where you spend the most time. Offices and bedrooms are the highest priority. I moved mine to the basement, where we spend the least time, and the difference in readings throughout the main living areas was immediate and significant.

What the WHO classification actually means. The WHO classifies RF radiation as a Group 2B possible carcinogen, a designation that’s often cited as evidence that there’s nothing to worry about. A 2B classification is frequently described as weak. What that framing leaves out is that the classification was made in 2011 and that multiple researchers who contributed to it have since publicly stated they believe the evidence now warrants a stronger classification.

The NTP study, one of the most comprehensive government-funded studies on RF radiation to date, found clear evidence of carcinogenic activity in animals. The Ramazzini Institute later replicated key findings at exposure levels closer to what people actually encounter in daily life. Neither study is definitive on its own. Together they are part of why hundreds of researchers have formally called for stronger protections. The science has not stood still.

After switching to the JRS Eco router, which reduces RF output when idle and only transmits actively when a device is actually using the internet, readings in standby dropped significantly compared to the conventional router. It’s one of the changes I’ve made that showed up clearly on the meter and that I’d recommend without hesitation.

If RF is your main concern: Wi-Fi routers are often the largest RF source in a home. The easiest first step is to measure the difference between standing near the router versus further back. RF drops quickly with distance, and where you place the router matters more than most people realize.

All Three Field Types at a Glance

Here are the precautionary benchmarks across all three field types, based on Institute for Building Biology and Ecology guidelines. These apply primarily to sleeping areas, where cumulative exposure time is highest.

Magnetic Fields (mG)

  • Low: below 1 mG
  • Moderate: 1 to 4 mG
  • Elevated: above 4 mG

Electric Fields (V/m)

  • Low: below 10 V/m
  • Moderate: 10 to 50 V/m
  • Elevated: above 50 V/m

RF, sensitive individuals (µW/m²)

  • Low: below 10 µW/m²
  • Moderate: 10 to 100 µW/m²
  • Elevated: above 100 µW/m²

RF, general precaution (µW/m²)

  • Low: below 100 µW/m²
  • Moderate: 100 to 1,000 µW/m²
  • Elevated: above 1,000 µW/m²

What to Do If Your Readings Are High

If your readings are above the precautionary benchmarks, the first step is source identification. Knowing where a reading is coming from tells you what you can actually do about it.

For magnetic fields: identify the appliance or wiring that is the source. Check the electrical panel, the stove, and any devices near where you sleep. Distance is your primary tool.

For electric fields: check for wiring in the wall behind your bed, power strips near the sleeping area, and devices that are plugged in but not in use. Switching circuits off at the breaker is the most effective approach when the source is in-wall wiring.

For RF: identify the strongest source, usually a Wi-Fi router or a phone on the nightstand. Distance, turning off Wi-Fi at night, or switching to a low-EMF router are the most practical reduction steps.

The home testing guide on this site walks through a room-by-room process for doing exactly this, including how to take before-and-after readings to confirm whether a change you made actually moved the numbers.

Why Location and Duration Matter as Much as the Number

One thing worth knowing is that the same number can mean very different things depending on where and when you measure it.

A magnetic field reading of 3 mG right next to a running hairdryer is expected and not particularly meaningful. The same reading at pillow height in the bedroom, sustained across eight hours every night, is a different calculation entirely.

The precautionary guidelines are specifically calibrated for sleeping areas because that’s where cumulative exposure is highest. A brief spike near an appliance you use for a few minutes is not the same as a chronic low-level exposure in the place where your body is supposed to be resting and recovering.

This is also why the testing process matters as much as the numbers themselves. Measuring at body height, in the places where you actually spend time, and over the course of a normal day gives you a far more accurate picture than a single spot check near the router.

Frequently Asked Questions

These are the questions I see come up most often from people who are just getting started with home EMF testing.

Are building biology guidelines the same as safety limits?

No. Building biology guidelines are voluntary precautionary benchmarks, not regulatory safety limits. Regulatory limits from bodies like ICNIRP are based on thermal effects and are orders of magnitude higher. The precautionary guidelines reflect a broader reading of the research, including non-thermal biological effects that the regulatory framework has been slow to incorporate.

What unit does an EMF meter use for RF?

Most consumer meters display RF in microwatts per square meter (µW/m²). Some meters also show milliwatts per square meter (mW/m²). To convert: 1 mW/m² equals 1,000 µW/m². The precautionary benchmarks in this article are in µW/m².

How do I know if my meter is accurate enough to use these benchmarks?

For general home testing, a well-regarded consumer meter like the Trifield TF2 is accurate enough to give you useful relative readings. The most important thing is consistency: measuring before and after a change, or comparing different spots in your home. For precisely calibrated RF readings, the Safe and Sound Pro II is the only widely available consumer meter that ships with independent calibration documentation.

Do these benchmarks apply to outdoor readings too?

They can be used as a reference outdoors, but the guidelines are primarily intended for indoor living and sleeping areas. Outdoor readings near cell towers can vary significantly and are harder to act on directly.

Is there a safe level of EMF exposure?

Regulatory bodies say yes, within their defined limits. Building biologists and a growing number of researchers say those limits don’t reflect the full picture of what the science shows. My honest take: the regulatory limits were not designed with long-term non-thermal effects in mind, and the researchers pushing for stronger standards have put forward a serious body of evidence. Taking simple precautions in the places where you spend the most time is a reasonable response to that uncertainty.

Your Numbers Mean More Once You Know What’s Behind Them

The benchmarks in this article give you a starting point. But what makes them useful is understanding what they’re actually measuring and why the two frameworks produce such different thresholds.

Regulatory limits tell you whether you’re in immediate physical danger from a thermal standpoint. Precautionary guidelines tell you something more useful for everyday life: how your home compares to what building biologists and environmental health researchers consider low exposure given everything the science currently shows, including the parts that haven’t made it into official policy yet.

If your readings are above the precautionary benchmarks in your sleeping areas, that’s worth acting on. The steps are simple, most of them are free, and the case for taking them is stronger than the official limits suggest.

Leave a Comment